Dear User,
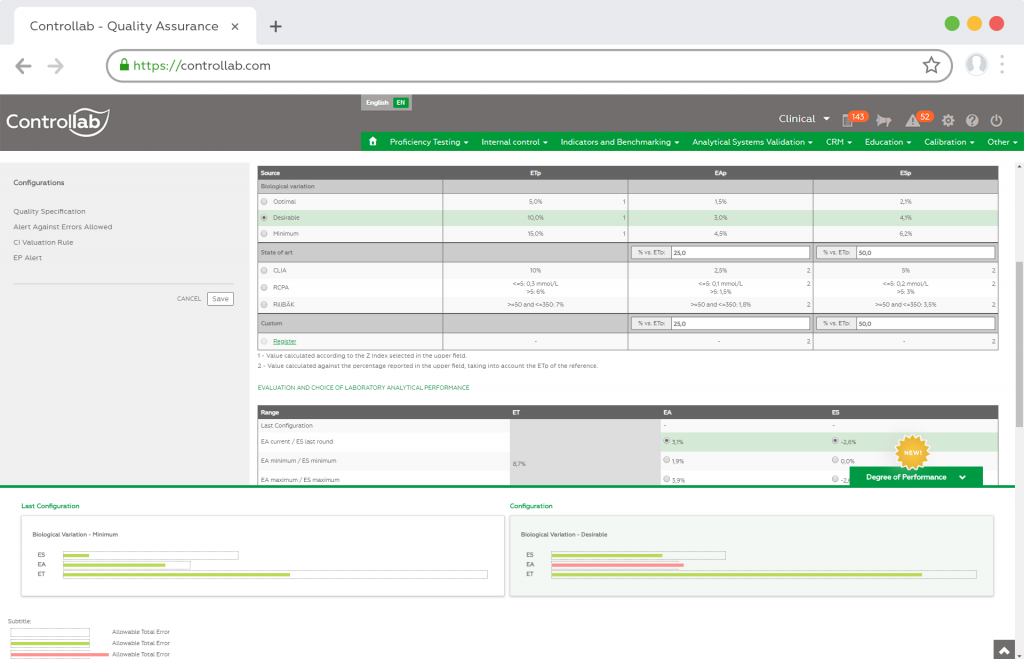
To assist the laboratory in defining the Quality Specification, the Performance Graph is available in the planning area, in which it is possible to immediately identify the analytical performance behavior obtained by the laboratory in relation to the selected specification.
During the specification review process, the chart shows a comparison of performance against the new specification and the previous one (last applied configuration) ensuring more confidence for decision making.
Certain of your satisfaction,
Controllab Team


