Dear User,
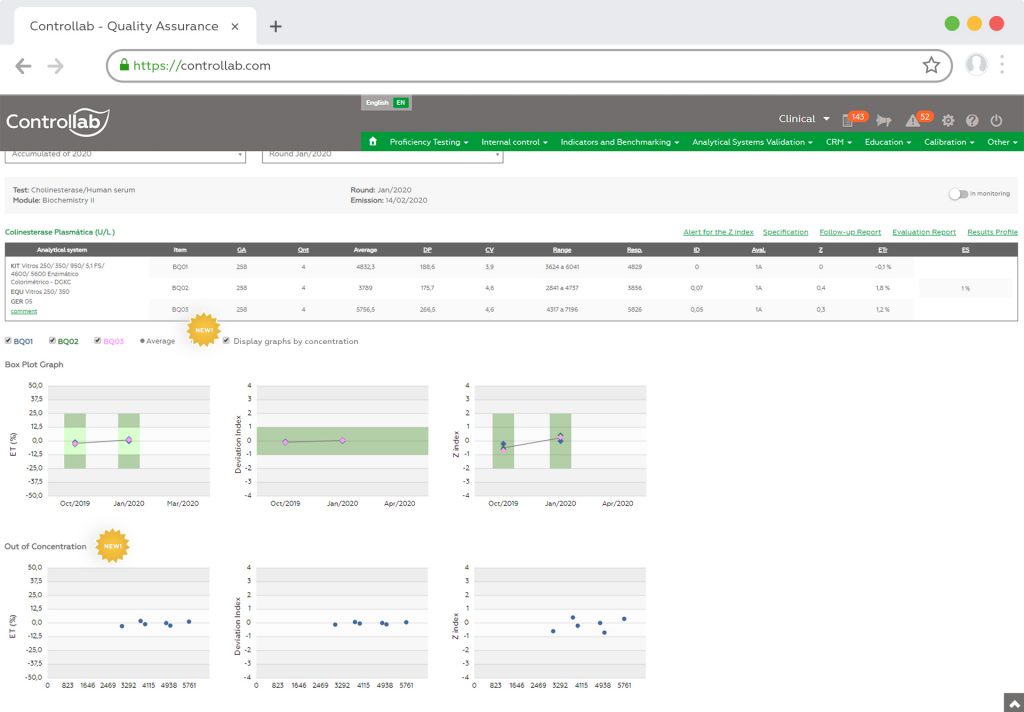
In order to contribute to the analysis of the data obtained in the Proficiency Test program, the option to display the Total Error, Deviation Index and Z Index by concentration graphs is available in the Proficiency Test Control Center.
These data assist in the identification of atypical behaviors for certain concentration ranges.
Certain of your satisfaction,
Controllab Team


