Dear User,
As of February 2023, we will gradually make the Histogram available for each evaluated test item, in order to facilitate the analysis of performance in the Proficiency Testing.
This type of graph helps to verify the dispersion of a group of data, summarizing large sets of them and enabling a quick comparison between them.
With the Histogram it is possible to observe the performance of your result against the group in which it was evaluated and also the generic groups, including the comparison between the behaviors of the groups. Thus, the laboratories enrich their critical analyzes at each round, in addition to obtaining the benefit of carrying out a market analysis of the performance of the analytical systems.
How to interpret the result in the Histogram?
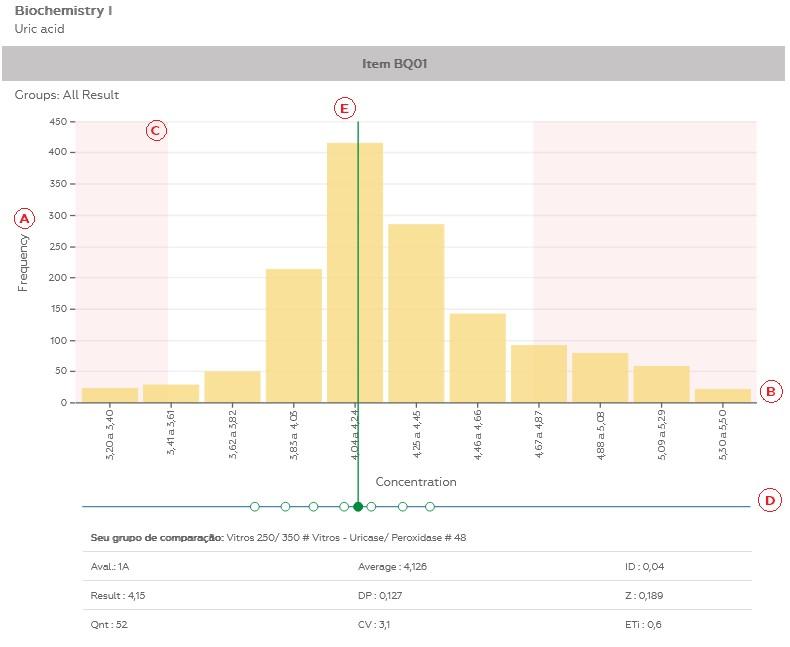
The Histogram is available per test item and shows the data distribution of your comparison group in addition to your laboratory’s position in relation to this distribution. A green circle (E) represents the result of your laboratory.
To facilitate the analysis, next to each graph, there is a table containing: the evaluation of your laboratory (including the result you reported), the amount of data present in your comparison group, the metrics of this group (Average, SD and CV) , the Deviation Index and the Z Index.
In the Histogram, it is possible to evaluate the frequency (A), that is, the amount of data reported in each concentration range (B), verify results considered inadequate (C) and adequate and the respective frequency in their comparison group (D).
Best Regards,
Controllab Team


