From the analysis of benchmarking data, it is possible to outline strategies to boost services and generate better opportunities for the laboratory.
Laboratories were already being challenged for some years to optimize their processes to generate better operating and financial results in the face of the transformations in the segment. However, in 2020, due to the Covid-19 pandemic, these challenges became even more complex with the social and economic impacts resulting from the disease.
Planning the development and growth of the laboratory requires realistic goals and monitoring, updated with market practices and performance. These consistent goals enable investment in actions that really make the laboratory strategically competitive. The most solid way to obtain this guiding information, which will be even more valuable in post-pandemic resumption, is using benchmarking.
Laboratory Benchmarking is an analysis of comparison of results between laboratories against the standards of excellence of the market. By using it, the laboratory improves its processes, improves services and generates more productivity and opportunities for the organization.
By participating in benchmarking programs, the laboratory optimizes time and resources in search of market information. For the user to understand in practice the benefits of the tool, figures 1 and 2, highlighted below, illustrate how benchmarking optimizes the organization’s efforts:

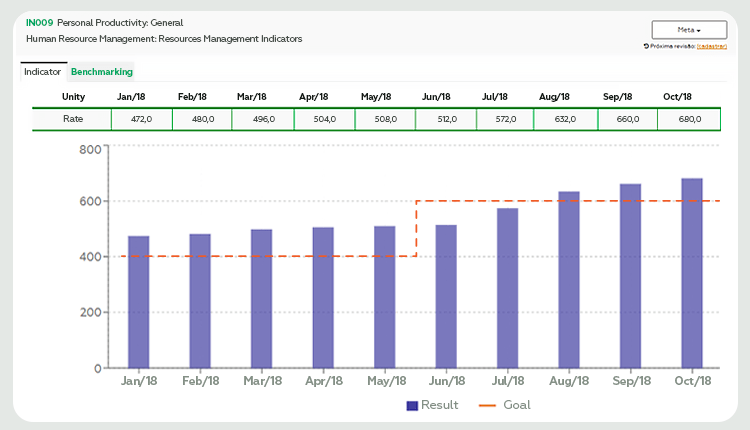
Figure 1 represents the case of laboratory X that established goals (orange line) to increase its productivity. The results (blue columns) show that, in the first months, the target was exceeded, being adjusted from June. Lab X sought to achieve this new goal, reaching it near the third quarter.
A first look at these results may indicate that the investments made and the goals achieved are leading to the planned objective. However, how to know if the goal defined by the laboratory is aligned with the competitive market scenario? Is this performance similar to that practiced by other laboratories with similar profiles? Figure 2 helps to answer these questions.

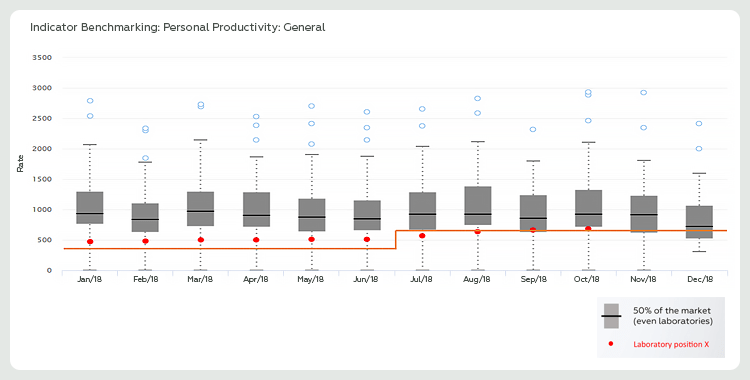
Figure 2 refers to the productivity benchmarking carried out between laboratories with profiles similar to laboratory X. The boxplot graph clearly shows how the data of these participants behaved. The black line, in bold in the graph, represents the productivity results achieved by 50% of its peers (institutions with the same profile as laboratory X).
When transporting the target (orange line) and the results (red dots) from laboratory X to benchmarking, we identified that although productivity presents a favorable behavior – meeting the initial expectations of laboratory X – it is still not enough to guarantee competitiveness of laboratory X opposite to the market.
Benchmarking enables laboratories to make assertive decisions, enabling continuous and up-to-date access to market data, guaranteeing references that are always in line with standards of excellence.
Delivering information to assess the organization in relation to the market and improve results are some of the objectives of the Benchmarking and Laboratory Indicator Program (PBIL), conducted by Controllab in partnership with the Brazilian Society of Clinical Pathology/Laboratory Medicine.
Through the data provided by the program, the laboratory can invest in actions that make it strategically competitive. This marketing vision contributes to reducing inefficient efforts and increasing the effectiveness of operations, optimizing the organization’s technical and financial resources.
The benefits of participating in the program, which helped to cope with the difficulties generated by the beginning of the pandemic, were evidenced in a recent congress of the segment. With the program, managers were able to make agile and data-based decisions, assess the efficiency of emergency actions and continue to monitor the performance of their business.
If before the scenario was already challenging for laboratories, with the current and future impacts of the pandemic, knowing the weaknesses and strengths of the laboratory are determining factors for the decisions of the coming months.
More information about PBIL and other Controllab solutions can be found on the website, pelo e-mail contato@controllab.com or by phone and WhatsApp +55 (21) 97901-0310 and +55 (21) 98036-1592.

